Citywide total
25,861
1.5% vs previous 12 months
Monthly Flagship Report
A monthly data briefing built for search, sharing, and local context. Use it to scan the current Calgary picture, community movers, and story angles worth pitching or posting.
Citywide total
25,861
1.5% vs previous 12 months
Avg community rate
22.8
Average incidents per 1,000 across comparable communities.
Largest drop
SOUTHVIEW
-31.0 / 1k
Largest increase
CORNERSTONE
+24.9 / 1k
153.7 incidents per 1,000 residents in the latest 12-month window.
3.8 incidents per 1,000 residents among communities with comparable population coverage.
-31.0 incidents per 1,000 residents, with 44.4% change versus the previous 12 months.
+24.9 incidents per 1,000 residents, with +43.7% change versus the previous 12 months.
Chart Asset
A reusable chart showing aggregate monthly reported incidents across Calgary communities.
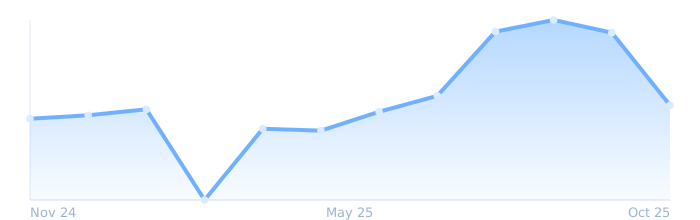
Chart Asset
Top communities with the biggest declines in incident rate per 1,000 residents versus the previous 12-month window.
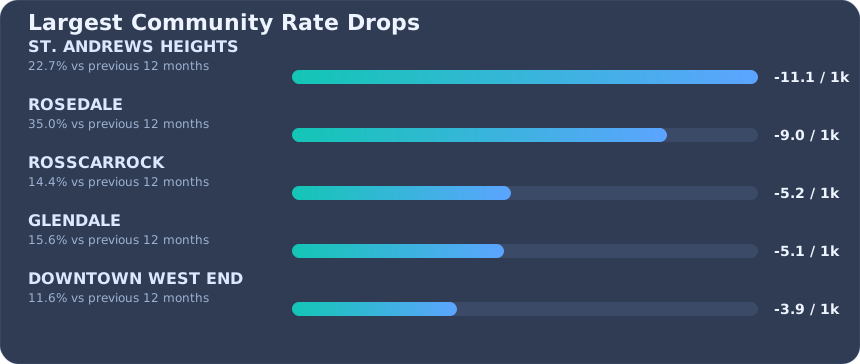
Chart Asset
Top communities with the biggest increases in incident rate per 1,000 residents versus the previous 12-month window.
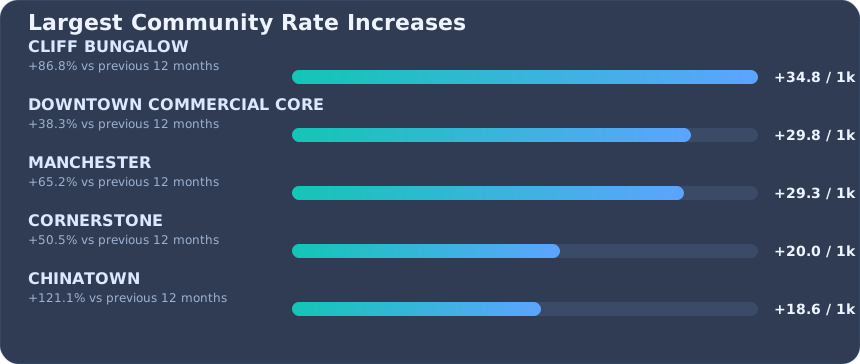
Calgary Crime Map turns official Calgary community-level incident data into a monthly, readable view of count, rate, change, and stability so residents can compare neighborhoods with more context.
Use with attribution to Calgary Crime Map and a link back to the report or methodology page.
Reported incidents come from official Calgary community-level datasets. Rates are normalized per 1,000 residents and compared with the immediately previous 12-month window.